🏠
About
Tableau
Gephi
Python
D3
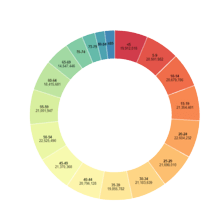
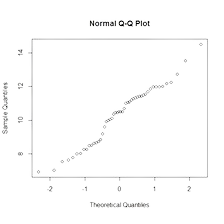
D3 Visualization on US Govt State Employment
I have done two visualization: Donut Chart and Q - Q plot Click to see the visualization